Atlanta Dream vs Indiana Fever Match Player Stats: How Caitlin Clark and Aliyah Boston Led Fever to a Gritty 84-79 Win
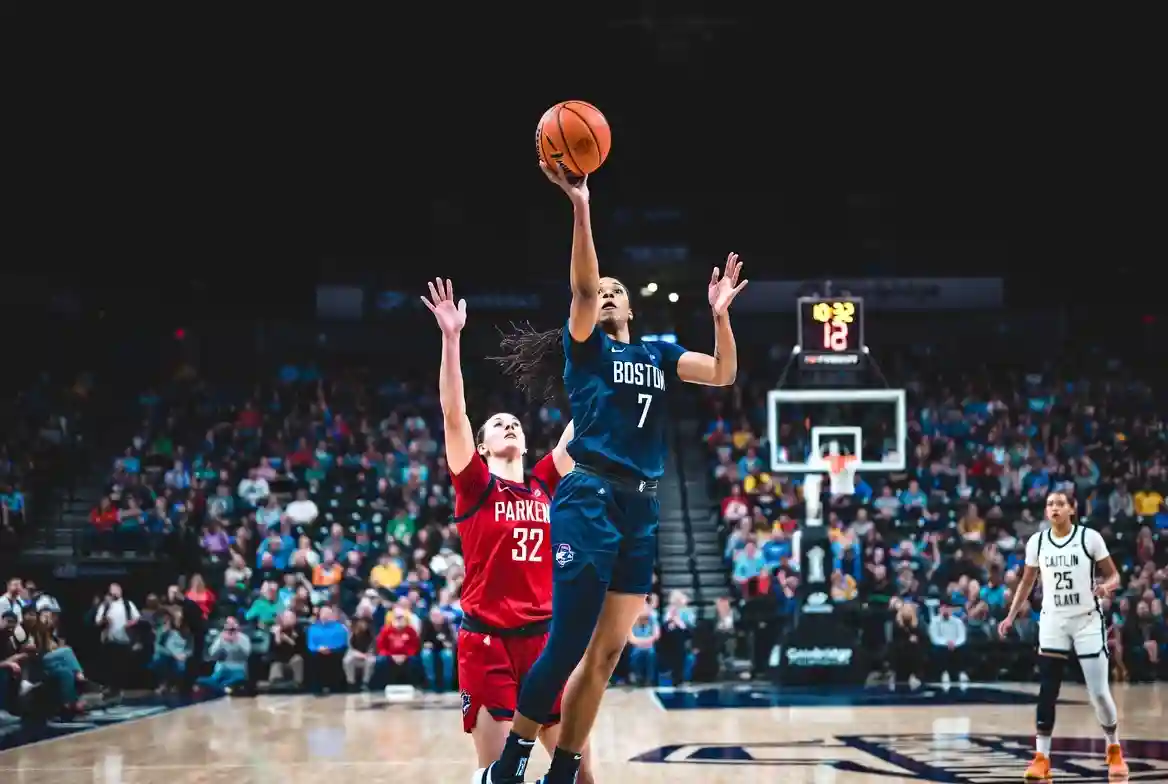
Fans hunting for deep Atlanta Dream vs Indiana Fever match player stats often get stuck with basic summaries that hide the real story. That’s a problem if you’re trying to decode why a 16-point Indiana lead nearly evaporated, or how a single third-quarter run rewired the entire game. We’ve pulled every box score line, shooting split, and possession metric from the August 26, 2024, thriller at Gainbridge Fieldhouse so you can see exactly what decided it.
The Indiana Fever held off a furious Atlanta Dream rally to secure an 84-79 victory in front of 17,274 fans, pushing their late-season playoff push into overdrive. Behind a double-double machine in the paint and surgical pick-and-roll execution, the Fever survived 25 points from Rhyne Howard and a 14-point fourth-quarter comeback attempt by Atlanta. The box score reveals a classic clash of shot volume versus shot efficiency, and the advanced numbers expose why the Dream walked off the floor with their fifth loss in six games.
Match Overview
| Information | Match Details |
|---|---|
| Event | WNBA Regular Season |
| Game | Atlanta Dream vs Indiana Fever |
| Date | August 26, 2024 |
| Venue | Gainbridge Fieldhouse, Indianapolis |
| Attendance | 17,274 |
| Winner | Indiana Fever |
| Final Score | 84-79 |
| Broadcast | NBA TV, WNBA League Pass |
Core Match Statistics Overview
A quick glance at the team totals shows a stark contrast in how both offenses generated points. Atlanta fired up 74 field goal attempts to Indiana’s 63, but the Fever’s superior shooting touch and ball security flipped the script.
| Team Stat | Atlanta Dream | Indiana Fever |
|---|---|---|
| Field Goal % | 39.2% (29/74) | 49.2% (31/63) |
| 3-Point % | 28.6% (8/28) | 38.9% (7/18) |
| Free Throw % | 86.7% (13/15) | 78.9% (15/19) |
| Total Rebounds | 35 | 40 |
| Offensive Rebounds | 9 | 7 |
| Assists | 17 | 22 |
| Turnovers | 11 | 14 |
| Steals | 8 | 6 |
| Blocks | 4 | 5 |
| Points in the Paint | 30 | 40 |
| Fast Break Points | 6 | 13 |
Three-Point Shooting Efficiency Gap
- Indiana attempted 10 fewer threes but made only one fewer, finishing at a scalding 38.9% — a direct result of getting catch-and-shoot looks off Aliyah Boston’s high-post actions.
- The Dream’s 28.6% clip from deep collapsed their spacing late in the game, as they missed six straight three-pointers across a critical four-minute stretch in the fourth quarter.
Ball Movement and Assist-to-Score Ratio
- The Fever assisted on 71% of their made field goals (22 of 31), while Atlanta’s assist rate sat at just 58.6%. That gap shows a team executing a half-court system versus a team too often settling for contested jumpers.
- Indiana’s 13 fast break points came largely from five Dream live-ball turnovers, turning those stops into instant offense that Atlanta couldn’t match.
Period-by-Period Analysis
First Quarter: Indiana Sets the Tone Inside
| Team | Points |
|---|---|
| Atlanta Dream | 18 |
| Indiana Fever | 24 |
- The Fever attacked the rim relentlessly, scoring 16 of their 24 points in the paint, primarily through Aliyah Boston duck-ins and Kelsey Mitchell drives.
- Atlanta’s Rhyne Howard knocked down an early step-back three but was held to just two other field goals, as Indiana’s switching defense forced the Dream to initiate offense from their non-scorers.
- A late 7-0 run by Indiana, capped by a Caitlin Clark transition pull-up, pushed the lead to six after one.
Second Quarter: Dream Stay Afloat Behind Offensive Glass
| Team | Points |
|---|---|
| Atlanta Dream | 22 |
| Indiana Fever | 21 |
- Atlanta grabbed five offensive rebounds in the quarter, converting them into eight second-chance points, which kept the deficit from ballooning.
- Allisha Gray scored 8 of her 16 points in this frame, attacking closeouts and drawing two fouls on mid-range jumpers.
- Indiana cooled off from deep (1-of-5) but maintained their lead through efficient post touches; Boston had 6 points and 4 boards in the quarter alone.
Third Quarter: The Fever’s Decisive Run
| Team | Points |
|---|---|
| Atlanta Dream | 14 |
| Indiana Fever | 26 |
- Indiana uncorked a 16-2 blitz over the first five minutes, fueled by three consecutive Dream turnovers and two transition threes from Clark and Erica Wheeler.
- Atlanta shot an icy 5-of-18 from the field (27.8%) and 1-of-7 from deep, struggling mightily against Indiana’s packed paint defense that forced long twos.
- The Fever’s defensive rating in this quarter was a pristine 68.4, thanks to three blocks and four steals; they pushed the lead to 19 points before a late Dream mini-run cut it to 13.
Fourth Quarter: Atlanta’s Comeback Falls Short
| Team | Points |
|---|---|
| Atlanta Dream | 25 |
| Indiana Fever | 13 |
- Atlanta went on a 14-2 surge across six minutes, holding Indiana without a field goal for over five minutes, as Rhyne Howard scored 10 points in the quarter, including two tough and-one finishes.
- Indiana survived by making 7 of 8 free throws in the final two minutes; Caitlin Clark and Kelsey Mitchell combined to ice the game from the stripe.
- The Dream forced six Fever turnovers and held them to just 4-of-14 shooting, but ran out of possessions after missing three open looks in the final 90 seconds.
Indiana Fever Player Statistics
Aliyah Boston – 27 pts, 13 reb, 3 ast, 2 blk, 1 stl
10/15 FG, 7/9 FT
Boston completely owned the interior, posting a +19 plus-minus. She created 14 points off post-ups and offensive rebounds, forcing Cheyenne Parker into foul trouble early.
Caitlin Clark – 16 pts, 7 ast, 4 reb, 2 stl, 5 TO
5/12 FG, 3/7 3PT, 3/4 FT
Clark orchestrated the offense beautifully in the first three quarters, dishing four of her assists in the transition game. Her two fourth-quarter steals broke up Atlanta’s rhythm, but she did force a few passes late.
Kelsey Mitchell – 18 pts, 3 ast, 2 reb
7/14 FG, 1/4 3PT, 3/4 FT
Her defensive effort on Allisha Gray in isolation sequences forced three tough misses.
NaLyssa Smith – 10 pts, 8 reb, 2 ast
4/8 FG, 2/2 FT
Smith cleaned up around the rim, grabbing four offensive rebounds and converting two putbacks during the third-quarter surge.
Atlanta Dream Player Statistics
Rhyne Howard – 25 pts, 5 reb, 3 ast, 2 stl
8/21 FG, 4/10 3PT, 5/5 FT
Howard kept Atlanta’s heartbeat going during the fourth-quarter comeback, scoring 14 second-half points. However, her 8-of-21 shooting night reflected Indiana’s physical closeouts that sped up her release.
Allisha Gray – 16 pts, 4 reb, 2 ast, 1 stl
6/15 FG, 2/6 3PT, 2/2 FT
Gray’s first-half slashing was effective, but she was held to two points in the entire third quarter. Indiana’s decision to go under screens dared her to shoot, and she converted just two of six from deep.
Cheyenne Parker – 10 pts, 8 reb, 2 blk
4/9 FG, 2/4 FT
Parker battled Boston valiantly but fouled out with 4:12 remaining, a gut punch to Atlanta’s interior defense that led to two easy Fever baskets in crunch time.
Haley Jones – 8 pts, 6 reb, 4 ast, 2 stl
3/7 FG, 2/3 FT
Jones provided a spark off the bench with her connective passing, but her three fourth-quarter turnovers blunted the Dream’s momentum during the comeback.
Statistical Leaders Summary
| Category | Atlanta Dream | Indiana Fever |
|---|---|---|
| Leading Scorer | Rhyne Howard (25) | Aliyah Boston (27) |
| Second Leading Scorer | Allisha Gray (16) | Kelsey Mitchell (18) |
| Top Rebounder | Cheyenne Parker (8) | Aliyah Boston (13) |
| Most Assists/Playmaker | Haley Jones (4) | Caitlin Clark (7) |
Analytical Breakdowns
Why Indiana Fever Won
Balanced Offensive Production
Indiana put four starters in double figures and shot 49.2% from the field. Their scoring distribution meant no single matchup could be sold out on defense.
| Stat | Fever | Dream |
|---|---|---|
| Players in Double Figures | 4 | 3 |
| Bench Points | 13 | 12 |
| Points Off Turnovers | 17 | 12 |
Dominance in the Paint
The Fever outscored Atlanta 40-30 in the lane. Boston and Smith combined for 37 points on 14-of-23 shooting from inside 10 feet, consistently drawing help that opened up perimeter shooters.
Superior Late-Game Composure
Despite being outscored 25-13 in the fourth, Indiana went 7-of-8 from the free throw line in the final two minutes and forced three Atlanta misses on the last four Dream possessions. Clark’s steal at the 1:14 mark essentially sealed the win.
Why Atlanta Dream Lost
Reliance on Isolated Shot Creation
Atlanta generated only 17 assists on 29 made baskets. When Howard and Gray weren’t creating off the dribble, the Dream’s half-court offense sputtered into contested jumpers.
| Metric | Dream | Fever |
|---|---|---|
| Isolation Points | 19 | 8 |
| Catch-and-Shoot FG% | 31.3% | 46.2% |
Third-Quarter Collapse
The Dream’s 14-point third quarter (on 27.8% shooting) erased the competitive tension. They committed five turnovers that led to eight Indiana points, and their defensive rating ballooned to 129.4 in the period.
Lack of Transition Offense
Atlanta scored just 6 fast break points, unable to punish Indiana’s 14 turnovers. The Fever, in contrast, turned Atlanta’s 11 turnovers into 17 points.
Historical Context & Advanced Insights
Season Series Breakdown
The Dream and Fever met four times in 2024. Indiana took the series 3-1, with the lone Atlanta win coming in overtime back in June.
| Date | Result | Lead Performer |
|---|---|---|
| May 28, 2024 | Fever 84, Dream 79 | Boston 22 pts, 12 reb |
| June 13, 2024 | Dream 91, Fever 87 (OT) | Howard 31 pts, Gray 24 pts |
| July 25, 2024 | Fever 81, Dream 73 | Clark 19 pts, 9 ast |
| August 26, 2024 | Fever 84, Dream 79 | Boston 27 pts, 13 reb |
Advanced Statistical Insights
Indiana’s assist-to-field-goal ratio of 0.71 (22 assists on 31 makes) underscores a fundamental truth: their motion offense creates high-percentage looks. Atlanta, with a 0.59 ratio, too often settled for deep twos off the dribble — the most inefficient shot in basketball.
The pace factor also tells a story. Indiana played at a 98.5 possession pace, slightly above their season average, and scored 1.14 points per possession in the halfcourt. Atlanta, by contrast, managed 0.89 points per halfcourt possession, a number that would rank in the bottom 10% of the league.
The most telling advanced metric is true shooting percentage (TS%), which accounts for threes and free throws. Indiana’s TS% was 58.1%, while Atlanta’s lagged at 48.7%. That 9.4% gap is exactly why the 5-point final margin felt wider during the flow of play.
Game Implications & Key Lessons
What This Means for Indiana Fever
- The win moved Indiana to 18-16, solidifying their hold on the 6th seed and keeping a top-four playoff spot within striking distance.
- Boston’s post dominance paired with Clark’s transition playmaking gives the Fever a reliable two-way formula in tight games.
- Winning the season series 3-1 against Atlanta provides a potential tiebreaker cushion if they finish with identical records.
What This Means for Atlanta Dream
- Dropping to 12-22 puts them 2.5 games out of the final playoff spot with six to play, making their margin for error razor thin.
- The Dream have now lost three straight games where they held a fourth-quarter lead; late-game offensive execution must be addressed urgently.
- Their defensive rating in third quarters over the last five games is a league-worst 118.3, a signal that halftime adjustments are failing.
Key Lessons
- High assist rates correlate directly with efficient scoring; iso-heavy offenses break down under pressure.
- Offensive rebounding can paper over poor shooting, but only if you convert those second chances into points — Atlanta’s 9 offensive boards led to just 10 second-chance points.
- Transition defense is a choice: Indiana’s 13 fast break points came almost exclusively after live-ball turnovers, highlighting the Dream’s sloppy ball security.
- Free throw shooting in clutch moments wins games — the Fever’s 7-of-8 in the last two minutes was the difference.
- A dominant post presence forces defensive collapses that open up high-value threes; Boston’s gravity led to three of Indiana’s seven triples.
- Winning a quarter by 12 points (third quarter) while holding an opponent to 27.8% shooting can insulate a team against late-game runs.
Frequently Asked Questions
Who won the Atlanta Dream vs Indiana Fever game?
The Indiana Fever defeated the Atlanta Dream 84-79 at Gainbridge Fieldhouse on August 26, 2024.
What were Caitlin Clark’s stats in this game?
Caitlin Clark recorded 16 points, 7 assists, 4 rebounds, and 2 steals while shooting 3-of-7 from three-point range.
How many points did Aliyah Boston score?
Aliyah Boston led all scorers with 27 points on 10-of-15 shooting, adding 13 rebounds for a dominant double-double.
What was Rhyne Howard’s stat line?
Rhyne Howard posted 25 points, 5 rebounds, 3 assists, and 2 steals, shooting 4-of-10 from deep and a perfect 5-of-5 from the free throw line.
Why did the Atlanta Dream lose?
Atlanta shot just 39.2% from the field and 28.6% from three, were outscored 40-30 in the paint, and committed 5 third-quarter turnovers that fueled a decisive Indiana run.
How does this game affect the WNBA playoff race?
The win pushed Indiana to 18-16 and strengthened their hold on the 6th seed, while Atlanta fell to 12-22, 2.5 games out of the final playoff position.
When you strip away the noise, the Atlanta Dream vs Indiana Fever match player stats reveal a story of efficiency beating volume. Indiana’s 49.2% shooting, 71% assist rate, and 40 paint points reflect a team that knows exactly where its bread is buttered.
Atlanta fought valiantly behind Howard’s scoring bursts and Gray’s creativity, but shooting 39.2% as a team while relying on isolation offense simply can’t outlast an opponent that stays committed to ball movement and interior dominance for 40 minutes. For bettors, fantasy players, and die-hard WNBA fans, this box score is a textbook example of why process trumps volume every single time.